Scopes
Introduction
Scopes refers to a set of nodes:
ColorStats doing the color analysis of a given textures and storing it into a data block
RenderWaveform and RenderHistogram reading this data block and representing this data in a fancy way
This document explains how to work with them, and in particular how to exploit the data block or build your own representation of the data.
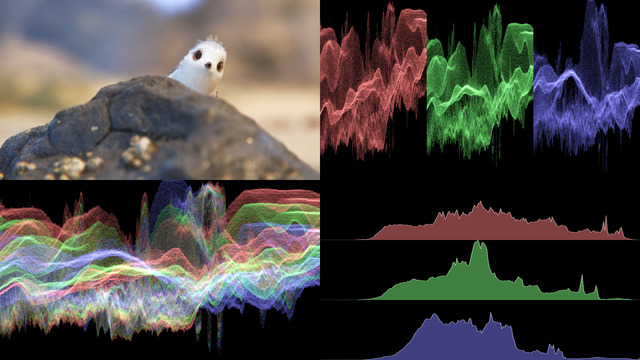
This screenshot comes from the scopes scene from the nope.demos repository.
Requirements
ColorStats relies on compute shaders and SSBO, which are available pretty much anywhere nowadays, but there are a few exceptions to keep in mind. MacOS OpenGL support is not sufficient and you will need to enable the Metal backend (through Vulkan/MoltenVK) to benefit from it. Also, some Android devices officially support them, but experience showed that reality begs to disagree.
So while effort has been made such that ColorStats runs as fast as possible and on all backends, your mileage may vary.
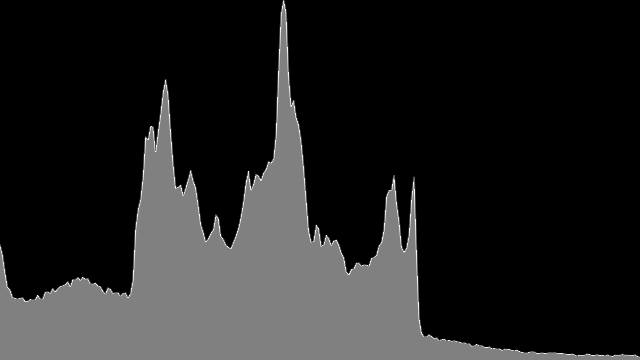
RenderHistogram
The histogram (bottom-right in the screenshot) is a 2-dimensional representation of the distribution of color in the input texture:
the x-axis represents the intensity of the color: absence of light on the left, maximum light on the right
the y-axis represents how much of each intensity is present in the texture
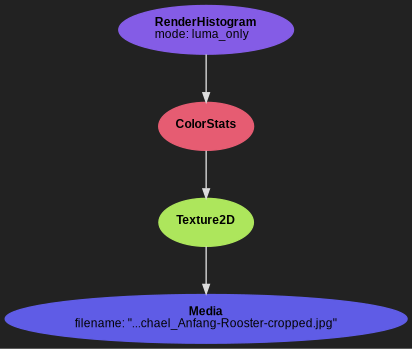
from pynopegl_utils.misc import load_media

import pynopegl as ngl


@ngl.scene()
def histogram(cfg: ngl.SceneCfg):
    image = load_media(cfg, "rooster")

    stats = ngl.ColorStats(texture=ngl.Texture2D(data_src=ngl.Media(image.filename)))
    return ngl.RenderHistogram(stats, mode="luma_only")
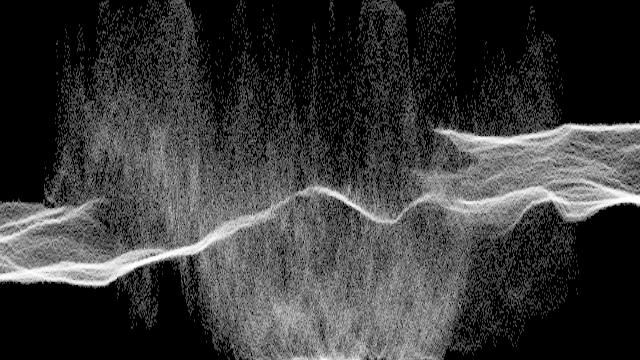
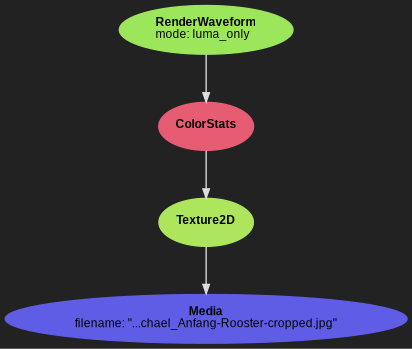
RenderWaveform
The waveform spectrum (top-right and bottom-left in the screenshot) is a 3-dimensional representation of the distribution of color in the input texture:
the x-axis is spatial: each column of pixels in the waveform is a mini-histogram of the same column of pixels on the input texture
the y-axis represents the intensity of the color: absence of light on the bottom maximum light on the top; it is equivalent to the y-axis in RenderHistogram
the z-axis represents how much of each intensity is present, and is communicated using the color intensity where black means 0 intensity and white the maximum intensity; it is an alternative representation of the y-axis in RenderHistogram
A simple way of understanding the representation is to consider that every column of pixels is like looking at an histogram from above (a peak in the histogram would be a bright color in the waveform)
from pynopegl_utils.misc import load_media

import pynopegl as ngl


@ngl.scene()
def waveform(cfg: ngl.SceneCfg):
    image = load_media(cfg, "rooster")

    stats = ngl.ColorStats(texture=ngl.Texture2D(data_src=ngl.Media(image.filename)))
    return ngl.RenderWaveform(stats, mode="luma_only")
ColorStats
The ColorStats interface is essentially the same as a Block. This means that in addition of being read by RenderHistogram and RenderWaveform, it can be attached to Render vertex or fragment resources, or Compute resources, and read in the corresponding shaders.
The following fields are accessible from the shader:
Name |
Type |
Length |
Description |
|---|---|---|---|
|
|
Single |
Maximum RGB value of summary and data |
|
|
Single |
Maximum luma value of summary and data |
|
|
Single |
Bit depth (256 for 8-bit, 1024 for 10-bit, …) |
|
|
Single |
Length of the image minus 1 |
|
|
|
Global histogram data |
|
|
|
|
Additional details:
We use the term “length” instead of “width” to because in the future it may correspond to the height.
summaryanddataare 4-component long for R, G, B and luma