Using Eval* nodes
Eval* nodes are useful to evaluate various expressions during the graph
evaluation. The complete list of operators, constants and functions can be
consulted in the Eval reference documentation.
Each node can be nested to create complex interwined relationships, and they are
not limited to float and vectors: Noise* or Color* nodes are also accepted
as input resources.
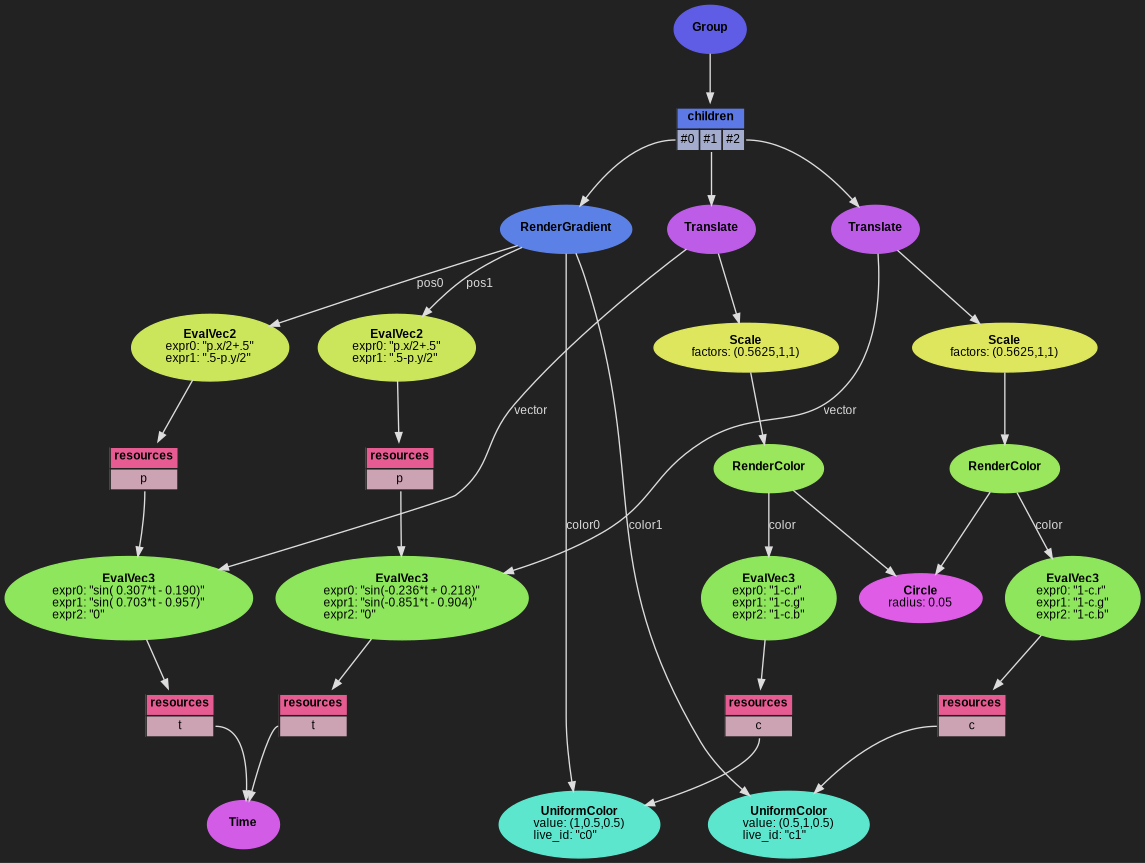
For example, the following example demonstrates how to animate the position of the 2 gradient positions:
import pynopegl as ngl


@ngl.scene()
def gradient(cfg: ngl.SceneCfg, mode="ramp"):
    cfg.duration = 15

    # Create live-controls for the color of each point
    c0_node = ngl.UniformColor(value=(1, 0.5, 0.5), live_id="c0")
    c1_node = ngl.UniformColor(value=(0.5, 1, 0.5), live_id="c1")

    # Make their positions change according to the time
    pos_res = dict(t=ngl.Time())
    pos0 = ngl.EvalVec3("sin( 0.307*t - 0.190)", "sin( 0.703*t - 0.957)", "0", resources=pos_res)
    pos1 = ngl.EvalVec3("sin(-0.236*t + 0.218)", "sin(-0.851*t - 0.904)", "0", resources=pos_res)

    # Represent them with a circle of the "opposite" color (roughly)
    # The scales are here to honor the aspect ratio to prevent circle stretching
    pt0_color = ngl.EvalVec3("1-c.r", "1-c.g", "1-c.b", resources=dict(c=c0_node))
    pt1_color = ngl.EvalVec3("1-c.r", "1-c.g", "1-c.b", resources=dict(c=c1_node))
    geom = ngl.Circle(radius=0.05, npoints=16)
    p0 = ngl.RenderColor(color=pt0_color, geometry=geom)
    p1 = ngl.RenderColor(color=pt1_color, geometry=geom)
    p0 = ngl.Scale(p0, factors=(1 / cfg.aspect_ratio_float, 1, 1))
    p1 = ngl.Scale(p1, factors=(1 / cfg.aspect_ratio_float, 1, 1))
    p0 = ngl.Translate(p0, vector=pos0)
    p1 = ngl.Translate(p1, vector=pos1)

    # Convert the position to 2D points to make them usable in RenderGradient
    pos0_2d = ngl.EvalVec2("p.x/2+.5", ".5-p.y/2", resources=dict(p=pos0))
    pos1_2d = ngl.EvalVec2("p.x/2+.5", ".5-p.y/2", resources=dict(p=pos1))
    grad = ngl.RenderGradient(pos0=pos0_2d, pos1=pos1_2d, mode=mode, color0=c0_node, color1=c1_node)

    return ngl.Group(children=(grad, p0, p1))
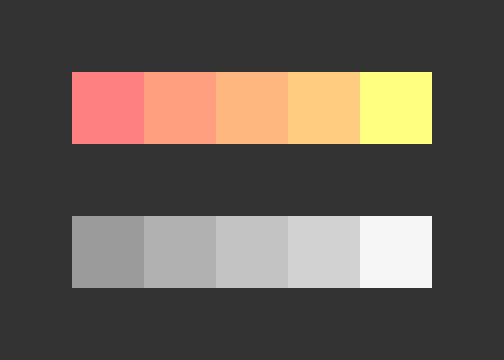
This previous example shows how we can craft positions, but also colors. The eval API proposes a few helper to work with colors, so we could use it for example to build an entire palette and its grayscale variant at runtime (so that it can reacts to live-controls):
import pynopegl as ngl


@ngl.scene()
def palette_strip(cfg: ngl.SceneCfg):
    cols, rows = (7, 5)
    cfg.aspect_ratio = (cols, rows)

    # The 2 colors to interpolate from
    c0_node = ngl.UniformColor(value=(1, 0.5, 0.5), live_id="c0")
    c1_node = ngl.UniformColor(value=(1, 1, 0.5), live_id="c1")

    # The 2 grayscale variants to interpolate from
    l0_node = ngl.EvalVec3("luma(c.r, c.g, c.b)", resources=dict(c=c0_node))
    l1_node = ngl.EvalVec3("luma(c.r, c.g, c.b)", resources=dict(c=c1_node))

    # Create each intermediate color
    c_nodes = []
    l_nodes = []
    for i in range(cols - 4):
        c_node = ngl.EvalVec3(
            "srgbmix(c0.r, c1.r, t)",
            "srgbmix(c0.g, c1.g, t)",
            "srgbmix(c0.b, c1.b, t)",
            resources=dict(c0=c0_node, c1=c1_node, t=ngl.UniformFloat((i + 1) / (cols - 1))),
        )
        l_node = ngl.EvalVec3("luma(c.r, c.g, c.b)", resources=dict(c=c_node))
        c_nodes.append(c_node)
        l_nodes.append(l_node)

    # Grid positioning of RenderColor nodes using GridLayout
    c_nodes = [c0_node] + c_nodes + [c1_node]
    l_nodes = [l0_node] + l_nodes + [l1_node]
    c_nodes = [ngl.RenderColor(node) for node in c_nodes]
    l_nodes = [ngl.RenderColor(node) for node in l_nodes]
    empty = ngl.Identity()
    cells = [empty] * (cols + 1) + c_nodes + [empty] * (cols + 2) + l_nodes
    strips = ngl.GridLayout(cells, size=(cols, rows))

    bg = ngl.RenderColor(color=(0.2, 0.2, 0.2))  # A gray background
    return ngl.Group(children=[bg, strips])
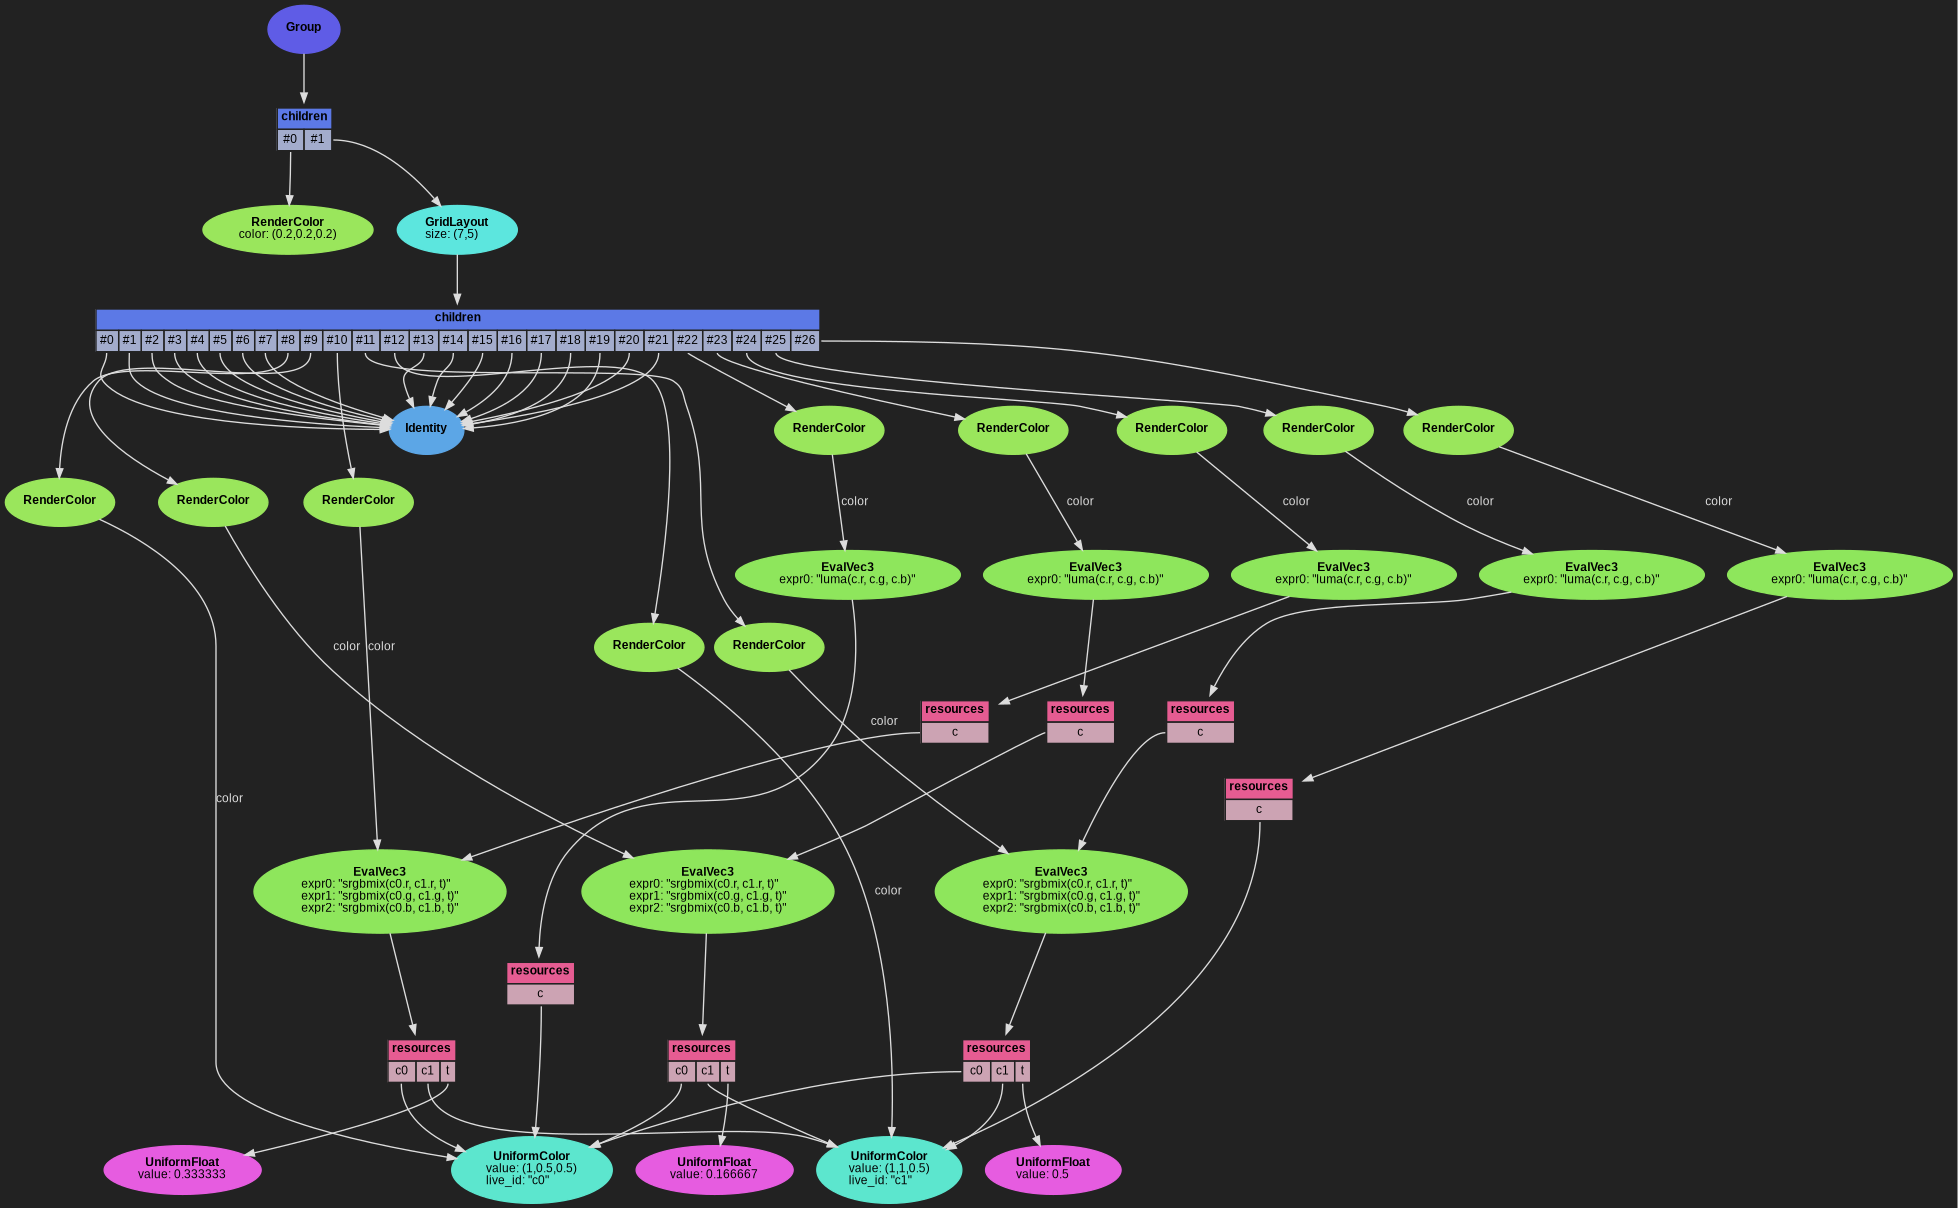
Here we’re using luma() to get the greyscale values, and srgbmix() to
interpolate between 2 sRGB colors (interpolation is done in linear space).
Of course, if the interpolation is not required at runtime (ie: the result does not depend on the time or live controls values), it is highly recommended to precompute them from the Python instead to have it computed only once.